 Jorgen Bergstrom
Rubber or Thermoplastic: a Stress-Strain Image Classifier
Introduction
A common way to learn how Convolutional Neural Networks (CNNs) work is to develop a tool that can classify whether an image is a cat or a dog (in this case all images are either of a cat or of a dog, no other options are allowed). I created an example that does just that.
Since my background is in polymer mechanics, I wanted a more interesting version of this classification task: given an image of a stress-strain curve, decide whether it comes from a rubber material or a thermoplastic. To make this work I collected experimental data files and generated stress-strain plots (PNG images) with engineering strain on the x-axis and engineering stress on the y-axis. To make the problem harder, I removed the axes from the images so that only the shape of the stress-strain curves is shown. Some of the data was obtained in uniaxial tension, and some in uniaxial compression. Some of the tests were monotonic loading, and some contained cyclic loading. For materials tested at several strain rates I generated one figure per test.
In total, I ended up with 490 figures of thermoplastics and 117 figures of rubbers. To make the data easier to handle I created a single multi-dimensional numpy array for each class: [490, 1, 400, 400] for the thermoplastics and [117, 1, 400, 400] for the rubbers. The first index specifies the number of images, the second index (1) specifies that there is only one channel (i.e. grayscale), and the last two indices specify the size of the images (400x400).
You can find the code and example images in this Jupyter notebook.
Model
The model is a small CNN built with PyTorch. It consists of three convolutional blocks, each pairing a 3x3 convolution with ReLU activation, batch normalization, and max pooling (with 32, 64, and 64 channels), followed by a fully connected layer with dropout and a single output neuron that gives the thermoplastic score. The 400x400 images are resized to 180x180 before training.
The data is split 75/25 into training and validation sets, and the model is trained for 25 epochs with the Adam optimizer (learning rate 3e-4) and binary cross-entropy loss, since this is a two-class problem. The trained CNN predicts whether a stress-strain image is a rubber or a thermoplastic with about 98% accuracy on the validation set. One caveat: because some materials had data at multiple strain rates, it is possible that images from the same material ended up in both the training and validation groups, which inflates the validation accuracy somewhat. A majority-class baseline (always predict thermoplastic) would already score about 81%, so the model does better than a trivial guess, but its true generalization performance on unseen materials is lower than the reported number. Nevertheless, it is an interesting problem.
Prediction from Claude Sonnet 5 (medium reasoning effort)
I showed Claude one of the axis-free images from the dataset:
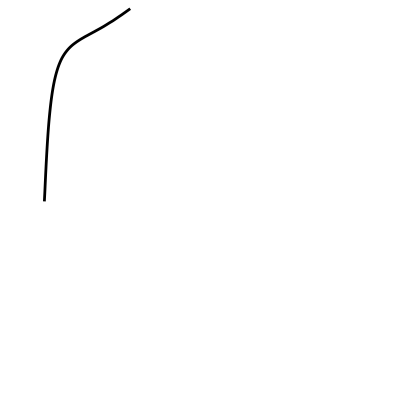
A trained polymer mechanics expert will immediately realize that this has to be a thermoplastic, since no rubber material will behave like that.
Then I asked the LLM this question:
I got this answer:
Looking at the curve: it starts with a steep, nearly linear rise from the origin, then bends over into a lower-slope, more gently rising (nearly straight) segment at higher strain — the slope decreases monotonically as strain increases, with no sign of an upturn.
That shape is more consistent with a thermoplastic than a rubber:
Thermoplastics typically show a steep linear-elastic region, a yield point, and then a flatter post-yield region (yielding/drawing) — exactly this “steep-then-shallower” concave-down profile. Rubbers/elastomers typically show a characteristic J-shaped (S-shaped) curve: low initial modulus, a shallow “rubbery plateau,” and then a pronounced upturn/strain-stiffening at large strains (due to limited chain extensibility or strain-induced crystallization). That upturn is the hallmark of rubber and isn’t present here. My confidence: moderate (~60-65%). A few caveats that limit certainty:
The image has no axis scale, so I don’t know the actual strain range shown — rubber curves can look like this if the plot is cut off before the strain-stiffening region kicks in (rubbers often need 300-700% strain before the upturn appears). There’s no visible yield point “knee” or post-yield plateau/hardening detail — just a smooth continuous curve, which is a bit ambiguous. Soft/filled rubbers or thermoplastic elastomers can sometimes blur this distinction.
In summary, Claude arrives at the right answer with reasonable reasoning, but only moderate confidence in it (60-65%). The CNN that I developed is much faster and provides a probability for every image.